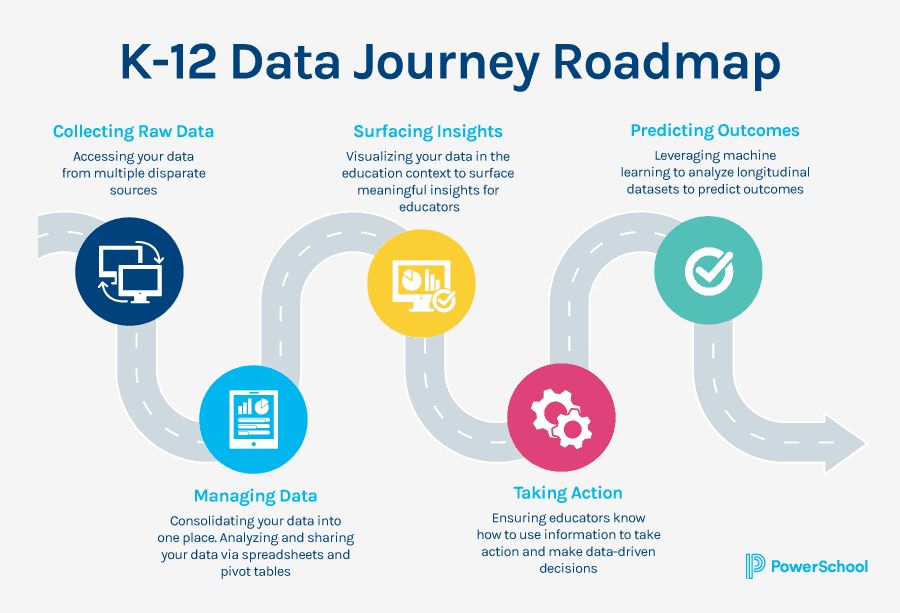
Every school and district collects and manages massive amounts of data. Whether it’s related to student success, teacher effectiveness, or front-office efficiencies, data-driven insights are key to understanding what’s really going on in a district.
K-12 data is almost never stored in a single place. And just collecting raw data doesn’t give you the information needed to make impactful decisions. You need to be able to view multiple sources—such as SIS data, learning management system (LMS) data, and data from assessment platforms—at the same time. When combined, this data becomes more impactful, providing a truly holistic view of student performance.
“As education leaders, we know things need to change,” says Anthony Padrnos, Executive Director of Technology at Osseo Area Schools. “How do we think about innovative change and build innovation cultures within our education systems? Data is a driving point to this.”
An integrated technology strategy helps ensure that every data point is leveraged to make the right decisions and truly impact student success. Read on to discover where your education organization is along the data journey, and how unifying your data can help you take the next step.
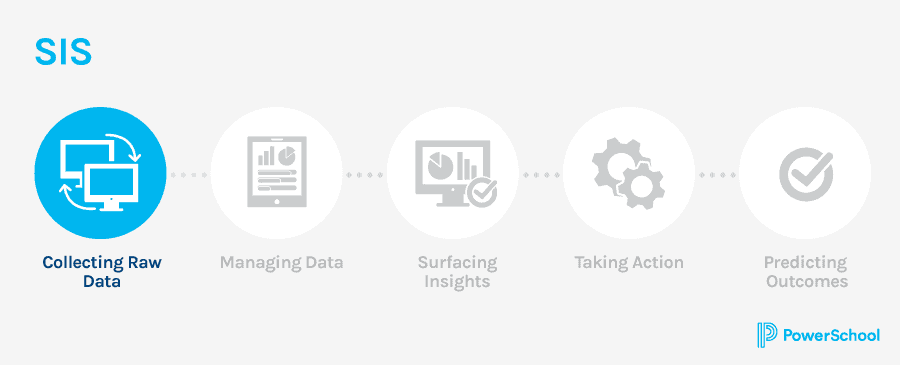
1. You Have a Student Information System (SIS)
Your SIS sits at the core of your student data management efforts. It allows you to easily access student information, attendance, schedules, report cards, and other raw data.
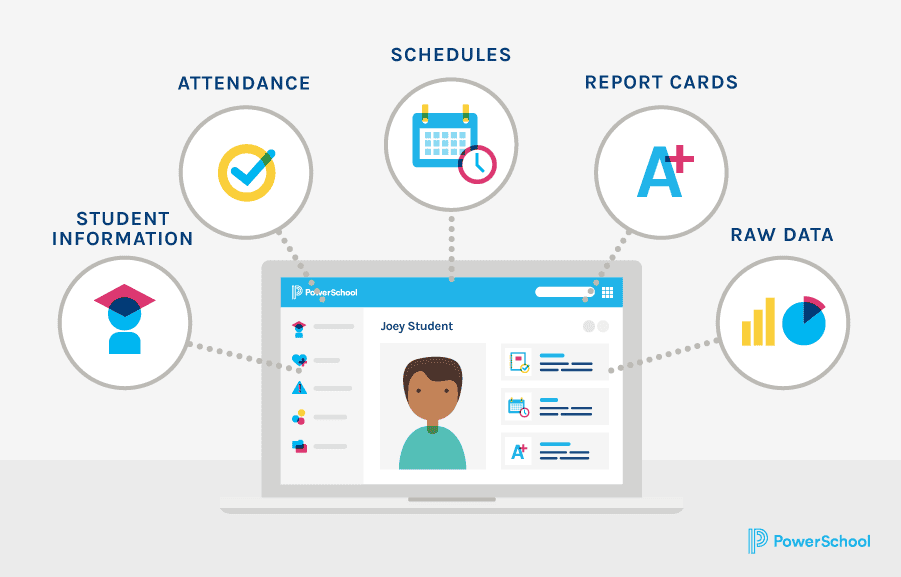
But raw data alone isn’t enough to predict student outcomes or take meaningful action to boost student success. It can be managed and organized, but it can’t easily surface true insights.
As you know, districts rely on multiple software systems to power their day-to-day operations. Data interoperability lowers costs, reduces demands on educators’ time, and drives efficiencies across the entire process of data analysis and data-driven decision making. An education ecosystem with data interoperability at its core also prepares education agencies to tackle the unknown challenges of tomorrow.
If your goal is to fully unleash the power of your SIS data, you must first connect and integrate it to other data sources. From there, you can effectively manage and analyze the data within a holistic system.
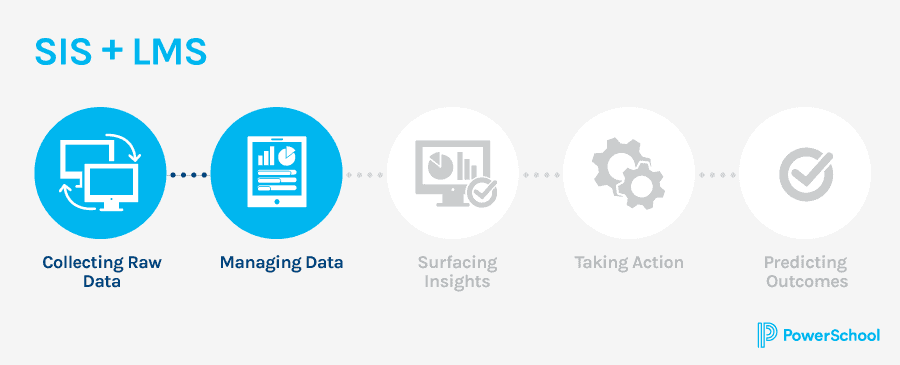
2. You Have an SIS and LMS
When you add an LMS to your SIS, you build upon collecting and managing the data in your SIS and empower teachers with personalized learning tools to improve education outcomes for every student. The LMS greatly increases the amount of data you’re collecting, from overall student performance and teacher engagement to detailed learning trends.

Combining SIS and LMS data adds another layer to your data journey. It helps deepen your collection of raw data and ensures your management of that data is stronger. It also begins the process of surfacing actionable insights that can lead you to measurable improvements.
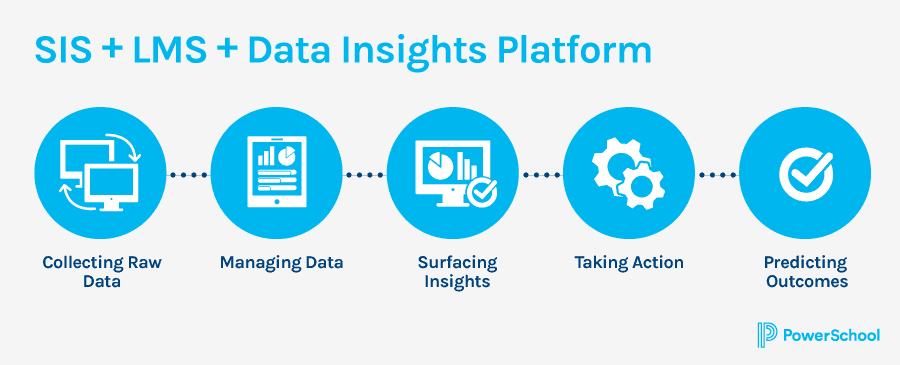
3. You Have an SIS, LMS, and Data Insights Platform
When you have an SIS, LMS, and data insights platform, you begin to uncover much more about the data you’ve collected. Not only are you able to collect and manage data, you’re also effectively surfacing key insights to take action with students where and when necessary.
This holistic approach to student data allows you to take more meaningful action and better predict student outcomes faster. You’ve developed a fully robust data journey and have the ability to easily monitor progress within your entire edtech ecosystem.
Practical Ways To Apply Holistic Insights
Unified data can give you the necessary insight to help you proactively address common challenges, including improving chronic absenteeism, learning gains, and Social and Emotional Learning (SEL). While these three areas are by no means simple fixes, having real-time, accurate insights allows you to action to address them with confidence.
In fall 2020, educators reported increased absenteeism rates for both remote learners (double the rates they saw before the pandemic) and in-person learners.1 The traditional method for addressing chronic absenteeism starts when teachers take attendance and usually ends with a plan to help students improve.
This plan allows teachers to monitor and report progress, but it doesn’t help them predict whether or not the plan will actually improve the student’s attendance. It’s also harder to monitor attendance in a remote learning environment.
Adding predictive models through a data analytics system like PowerSchool Analytics & Insights helps teachers proactively identify at-risk students before absenteeism becomes chronic. It can also help figure out the underlying causes of absenteeism, which can then be addressed more readily in person and online.

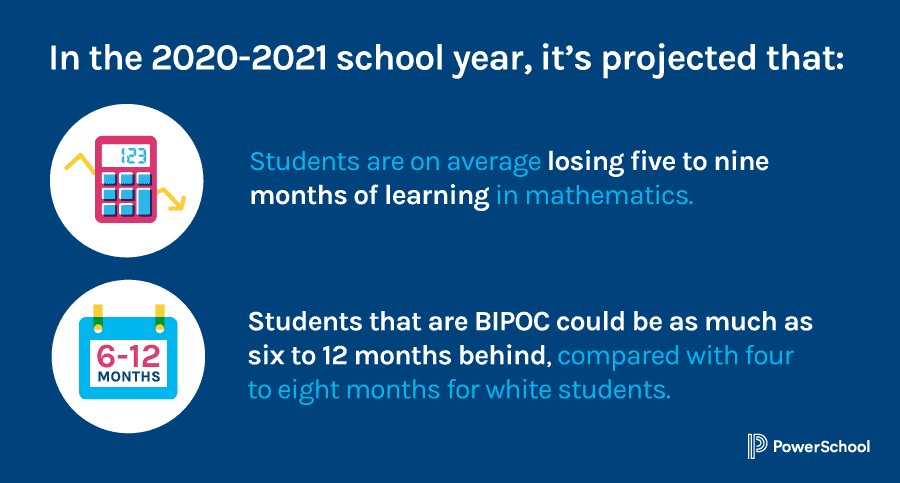
Students of color could be six to 12 months behind by the end of this school year, compared with four to eight months for white students.2 Improving learning gains will be critical in the coming school years to get students back on track from COVID-19 pandemic disruptions.
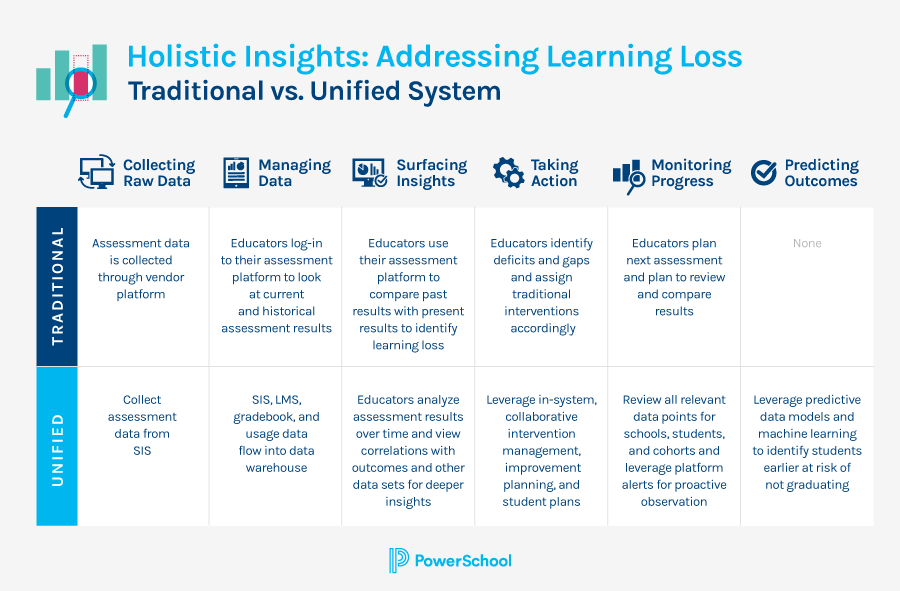
Improving learning gains usually begins at the assessment level, figuring out where students are achieving stronger performance and where they are not. That data can then be combined with regular gradebook data from the LMS as well as SIS data and then be contextualized and analyzed alongside other datasets.
At that point, learning gaps may be clear enough to begin traditional interventions and monitor student progress. Predictive analytics can help identify which students may need these interventions sooner—long before graduation readiness becomes an immediate issue. Predictive analytics can identify at-risk students and student groups when there’s still time for true meaningful interventions, not as a last resort.
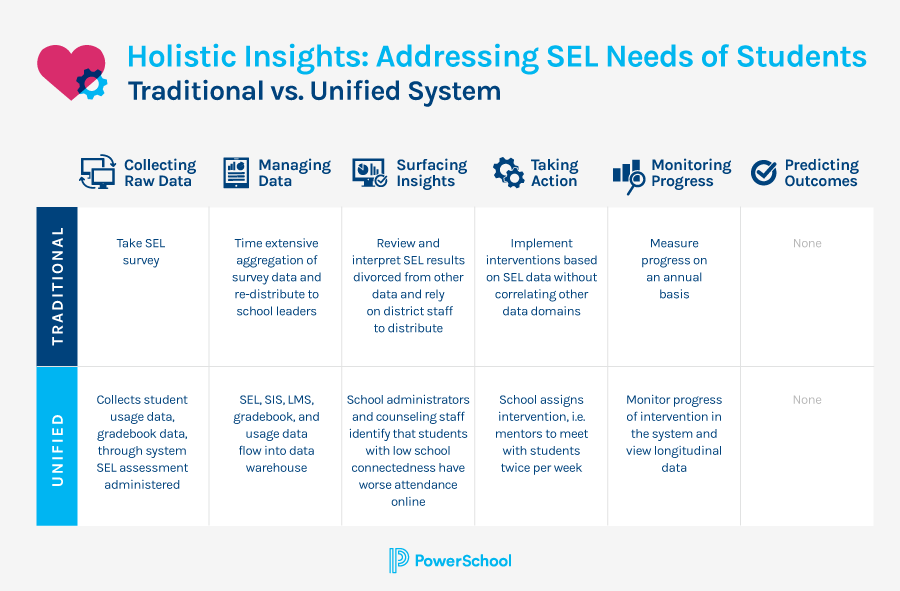
More than half of California students said they experienced serious stress, anxiety, or depression at least some time during the last year.3 Typically, SEL progress is measured on an annual basis, checking in on the interventions decided on the year prior and adjusting them based on new data and other factors.
This process leaves much to be desired, with time-intensive aggregation of SEL survey data and interpretations of SEL results. By proactively addressing SEL needs with a robust data analytics platform, much of that work is done automatically.
Instead, school administrators and counselors can spend time identifying SEL trends, meet more regularly with students, and monitor their progress more easily and quickly with true views of longitudinal data.
Conclusion
Practical applications of holistic data insights solutions like PowerSchool Analytics & Insights reach every sector of K-12 education—from the classroom, to individual schools, and districtwide. The true value of data becomes clear when taking that next step beyond simply raw data collection. When you can spot patterns, evaluate courses of action, and implement change with greater precision based on a more holistic understanding of student performance, you’re well prepared for future success.
Insights Report: The Evolving Role of Education Data
Learn five key data trends that can help guide more flexible, inclusive, and equitable education environments for all students.
Get Your CopyResources
- The 74 Million, What Does ‘Attendance’ Mean for Remote Learners in a Pandemic?, January 2021
- McKinsey & Company, COVID-19 and learning loss—disparities grow and students need help, December 2020
- EdSource, Why mental health is the key to dealing with learning loss, April 2021